
Thanks to an amazing partnership funded by Raytheon for Engineering is Elementary (EiE) out of the Boston Museum of Science, Maury students are taking part in a variety of engineering units. I was also trained at an EiE Teacher Educator Institute, along side a great group of Einstein Fellows at NSF in January. All of that has led to what you are about to see: 3rd graders becoming environmental engineers!


 |
| The EiE Engineering Design Process graphic. |
The book also introduces students to real life materials used to clean an oil spill, as well as any other content specific vocabulary they need for the unit.
Then comes the scientific testing! We turned to learning more about tests environmental engineers may actually use in their work by being introduced to the fictional city of "Greentown". Students receive a "letter from the Mayor of Greentown, informing them that the frogs and plants were dying in the town and they learn why!
Students explore pH and how acidic and basic soil and water can effect an ecosystem. The "mayor" then sent soil and water samples from various places around the town for students to test and use that data to determine why the frogs and plants were dying.


Here is the full "transcript":
 |
| I posted this letter but I also had my husband act as the mayor. Each time a letter was sent, we would get a voice recording "left on my phone" with our new assignment! |
Our inconsistent data actually proved to be an excellent teachable moment! Students figured out, for example, that it was critical that they read the pH strips just after testing for the color changed as they dried, changing the resulting number. Our final data table is below.
 |


The mayor of the city provided us with details about each area of the city to help us figure out what was causing the problems.

Before students made their final recommendations to the Mayor of Greentown, I found it important to make connections to their real-lives, as well as provide more scientific information for them to use. In Greentown, one of the problem areas was where there was a road salt spill that was improperly cleaned up. During this unit, we happened to be in the middle of storm after storm, which made road salt ever present ( on the roads and literally all over the floor of our classroom). We took an additional class to look at this specific concern and after reaching out on Twitter, found two wonderful resources.
The first resource is a great animated short called " A Drop's Life" put out by DC Water. It is all about storm water runoff and why it is important to consider in a city like DC.
(This is really a brilliant 5 minute video! Watch it!)

You can read his story here: http://wamu.org/news/14/03/04/road_salt .
We even collected snow samples from our very own school grounds where salt had been spread and tested these samples to see how it made the water more basic!
.JPG)
.JPG)
Once again, current events played a large role in my lesson planning. In March, there was a large oil spill near Galveston, Texas. To frame the importance of their work, I had the Mayor send the following message to the students, asking them to help the Mayor of Galveston and the REAL scientists and engineers working at that very moment to save as much as the ecosystem as possible.

 |
| Galveston, Texas boom from spill and birds effected. |
 |
| Dr. David Evans introduces himself to the class before getting to "work" with our young scientists. (Photos courtesy of Robert Pohl) |
 |
| Using "C" sign for contain, "A" for absorb in predicting what materials would do when in contact with oil. |
 |
| Even with our best efforts, oil moved out of its ideal "blob". While this made controlling this variable more difficult, it was equally as much a learning moment for students to see how easily oil moves and spreads on water. |
 |
| Testing each material. Recording results. |
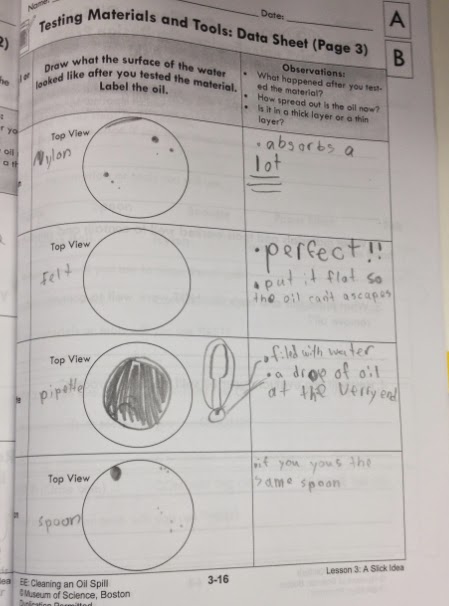 |
| Example of student observations. |

The final step in this amazing learning odyssey, is for students to use this information to construct their own oil spill clean up devices. However, timing has it that....spring break happened...which is when I'm writing this update.
So what happens next? Well, when we return, this group of students will be embarking on their next unit, an amazing partnership in game design with Labyrinth Puzzles and Games. However, we can't just leave this data hanging without completing the final challenge! 92% of the 56 3rd graders have jumped at the chance to complete the final step in this learning process: making their own oil spill clean- up device using what they learned about the materials! Students will be coming to me for three extra classes (recess environmental engineer club) where they will complete this final step.
If our budding environmental engineers' work during this unit is any indication of the solutions they will create, I know they will show incredible scientifically grounded, creative solutions to this final challenge. Stay tuned for their amazing work!
Until next time,
-Vanessa Ford
No comments:
Post a Comment
Feel free to leave a comment!